I'm a Data Analyst at NUS Consulting Group, leveraging data to drive strategic insights.
My foundation is anchored in a Master's degree in Computer and Information Systems, where I merged engineering prowess with business management.
With a rich blend of technical and strategic skills, I'm dedicated to addressing analytical challenges across various industries.
About me
I am passionate about Data Science and Sustainable Solutions, dedicated to leveraging my expertise to develop innovative strategies. By utilizing advanced data analysis and visualization techniques, I strive to drive meaningful impact and improve end-user experiences.
Commercial banks receive a lot of applications for credit cards. Many of them get rejected for many reasons, like high loan balances,
low income levels, or too many inquiries on an individual's credit report, for example. Manually analyzing these applications is mundane,
error-prone, and time-consuming (and time is money!).
Luckily, this task can be automated with the power of machine learning and pretty much every commercial bank does so nowadays.
In this notebook, we will build an automatic credit card approval predictor using machine learning techniques, just like the real banks do.
We'll use the Credit Card Approval dataset from the UCI Machine Learning Repository.
First, we will start off by loading and viewing the dataset.
We will see that the dataset has a mixture of both numerical and non-numerical features,
that it contains values from different ranges, plus that it contains a number of missing entries.
We will have to preprocess the dataset to ensure the machine learning model we choose can make good predictions.
After our data is in good shape, we will do some exploratory data analysis to build our intuitions.
Finally, we will build a machine learning model that can predict if an individual's application for a credit card will be accepted.
For more details, check my Jupyter notebook related to this project Github.
Fossil fuels have been the primary source of energy for most nations since the Industrial Revolution,
leading to negative impacts on the environment and human health.
The burning of fossil fuels accounts for approximately 75% of global greenhouse gas emissions, which causes an estimated 5 million premature deaths each year.
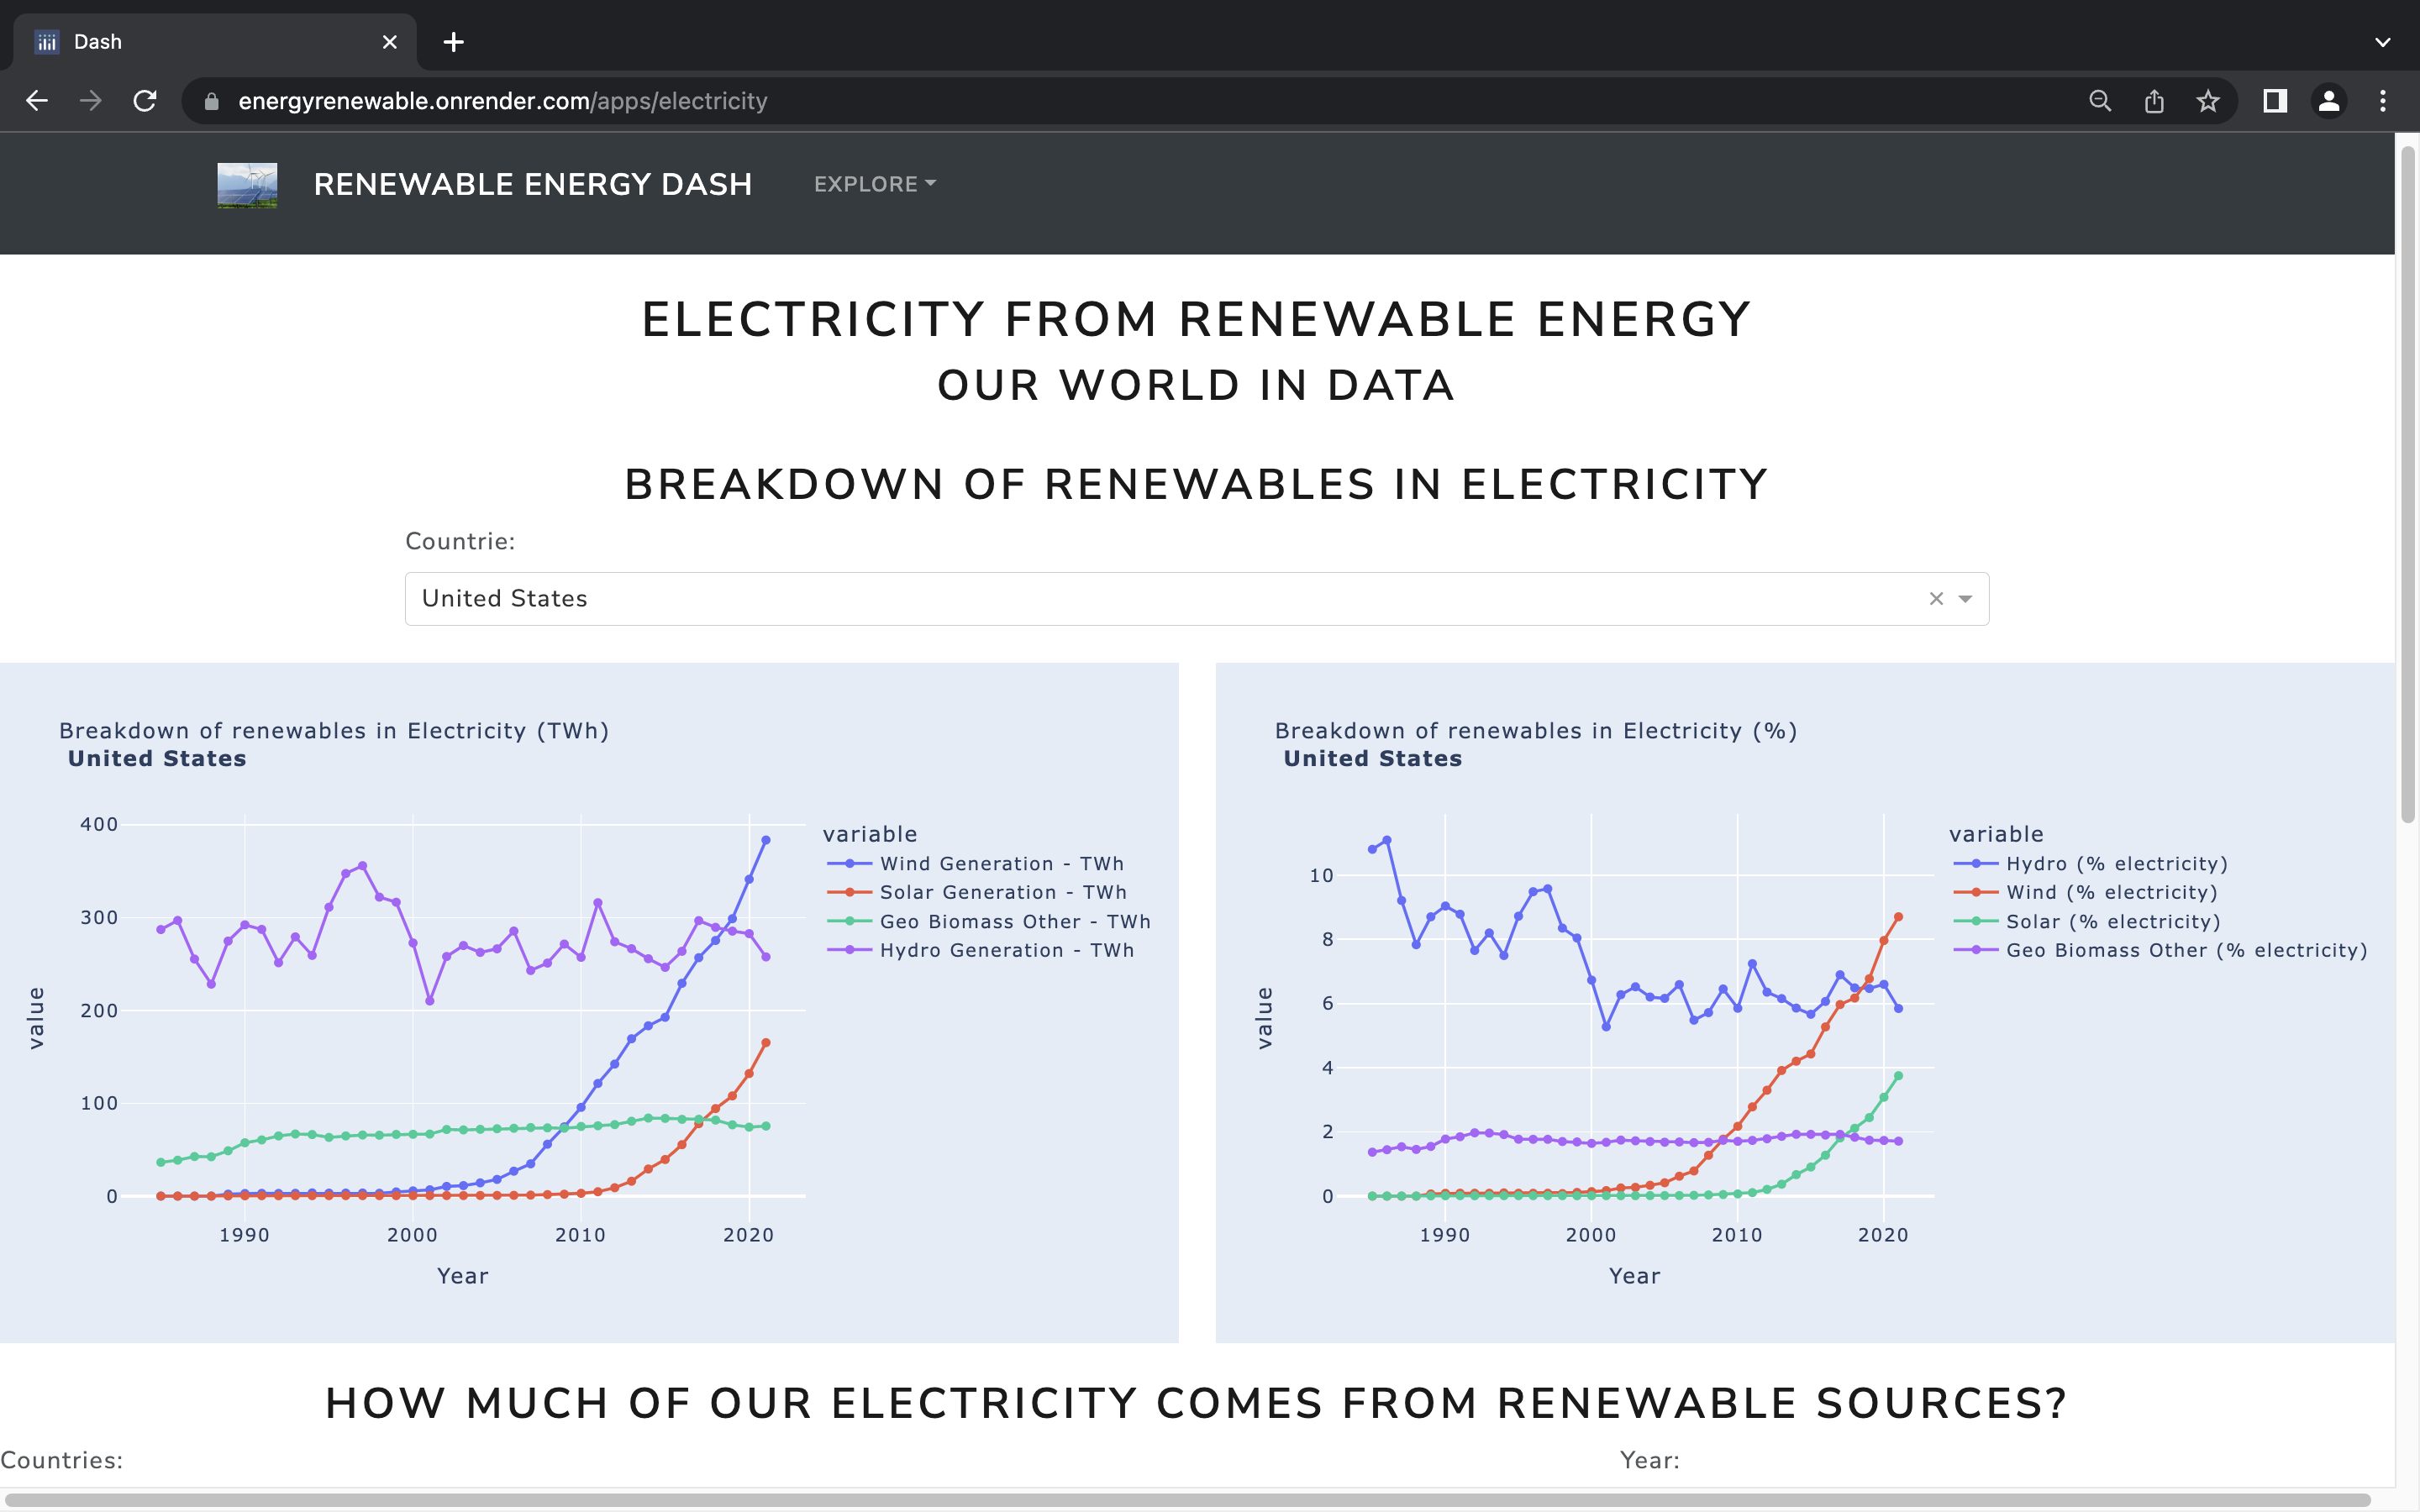
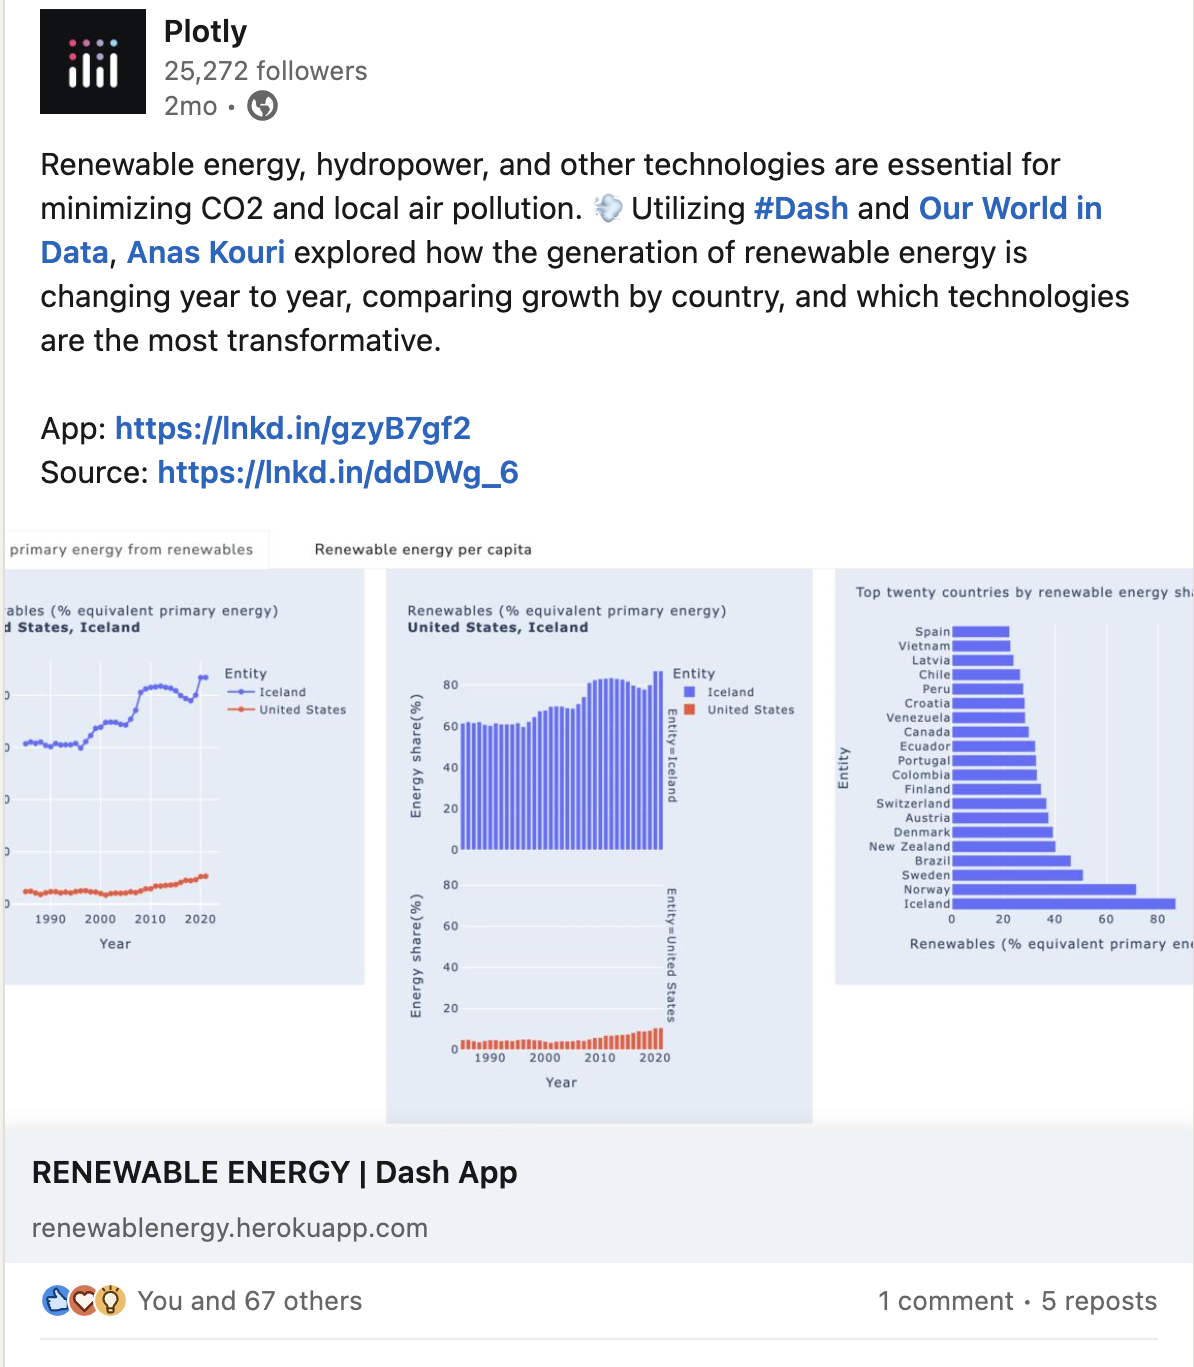
It is necessary for the world to move towards low-carbon energy sources and renewable technologies to reduce CO2 emissions and local air pollution.
To understand the growth of renewable energy in different countries and the most promising technologies for transforming our energy mix,
I created a web application using Dash-Plotly and Python and deployed it on Render.
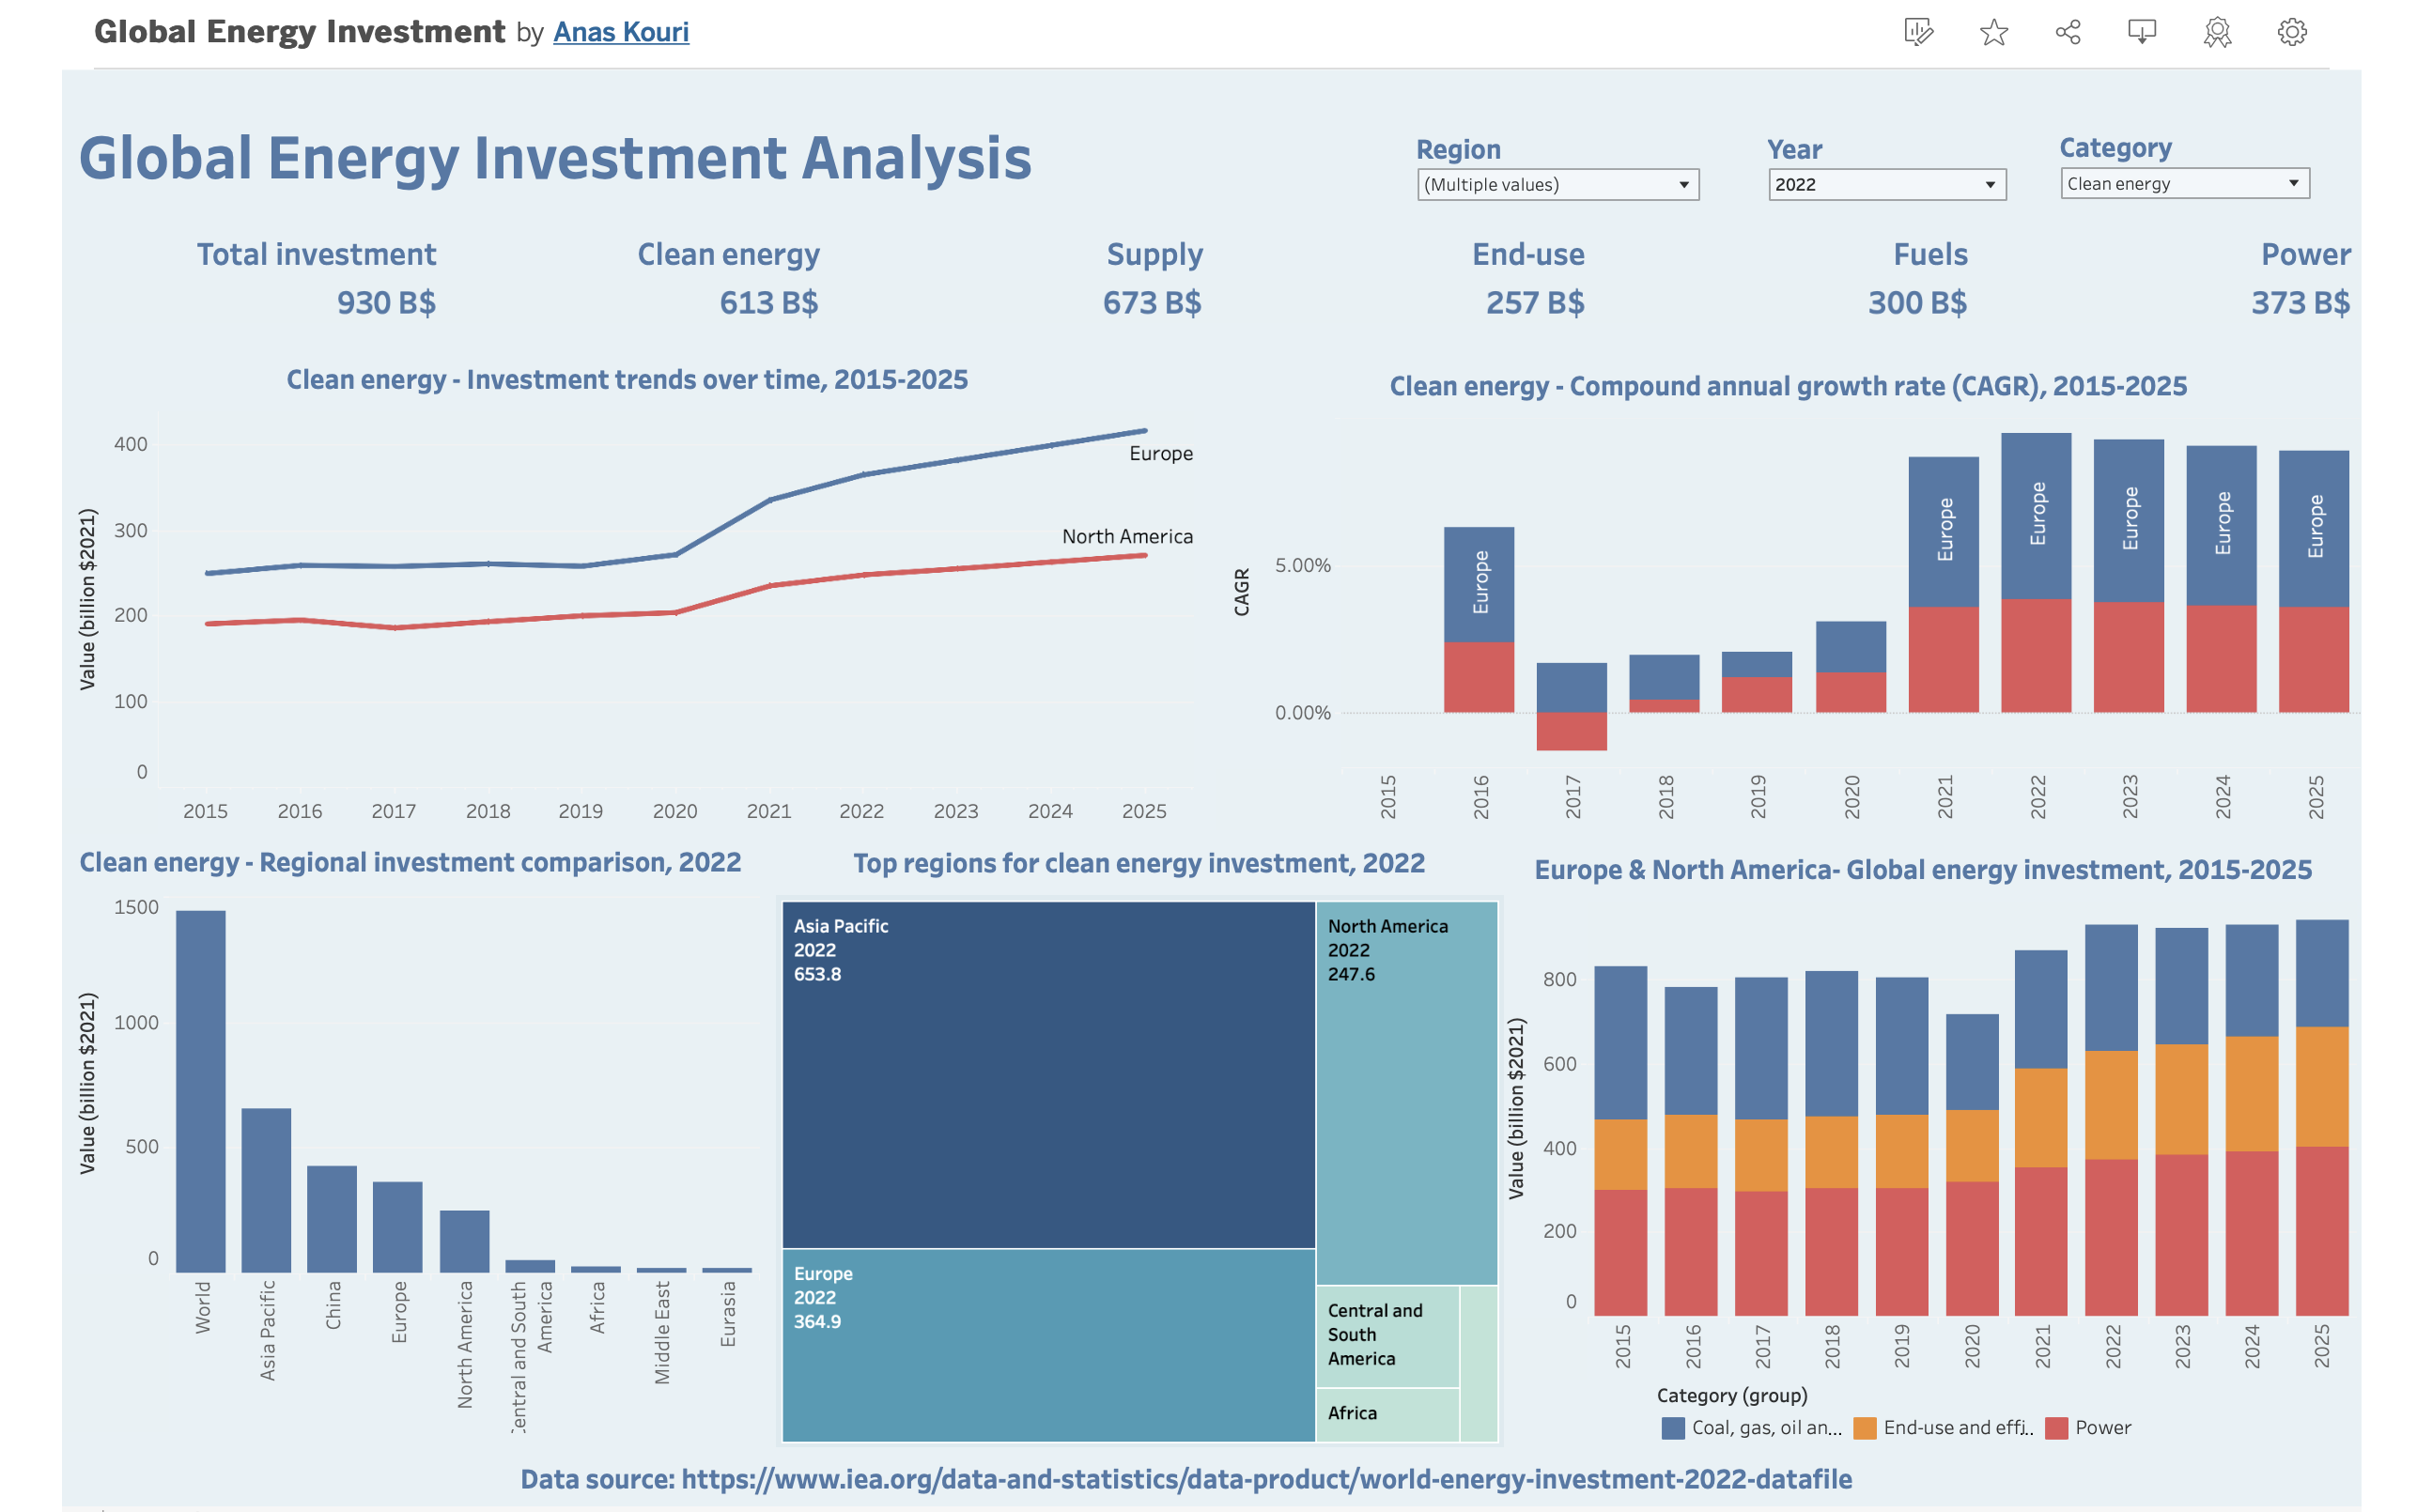
I am excited to present the Global Energy Investment Dashboard with Forecast, a comprehensive and interactive Tableau visualization that provides insights
into energy investments worldwide and forecasts trends for the upcoming three years. This dashboard has been carefully designed to facilitate an in-depth analysis
of investment trends, distribution, and growth across various regions, categories, and subcategories.
The dataset used for this dashboard contains information on energy investments made over the last seven years,
including investment amounts, years, and the corresponding region/category/subcategory details. By leveraging Tableau's powerful visualization capabilities,
the dashboard presents a range of Key Performance Indicators (KPIs) such as:
Additionally, the dashboard features a forecast of energy investments for the next three years, offering valuable insights into the expected growth and distribution of investments across different regions, categories, and subcategories.
The dashboard employs a variety of visualization types, such as bar charts, line charts, and tree maps, to ensure that the information is visually appealing and easy to understand. It also includes filters and interactive elements that allow users to customize the view and focus on specific areas of interest.
This Global Energy Investment Dashboard with Forecast serves as an excellent example of how Tableau can be used to analyze complex datasets and create visually engaging, informative, and user-friendly data presentations, along with providing future insights. The dashboard is now available for viewing on my portfolio website, and I welcome any feedback or suggestions for improvement.
Visit the Global Energy Investment Dashboard with Forecast "Dashbard-Link" . to explore the insights and trends in energy investments worldwide and their future projections.
Data Analysis and Visualization using SQL & Tableau
Year: 2023
Brooklyn, NY
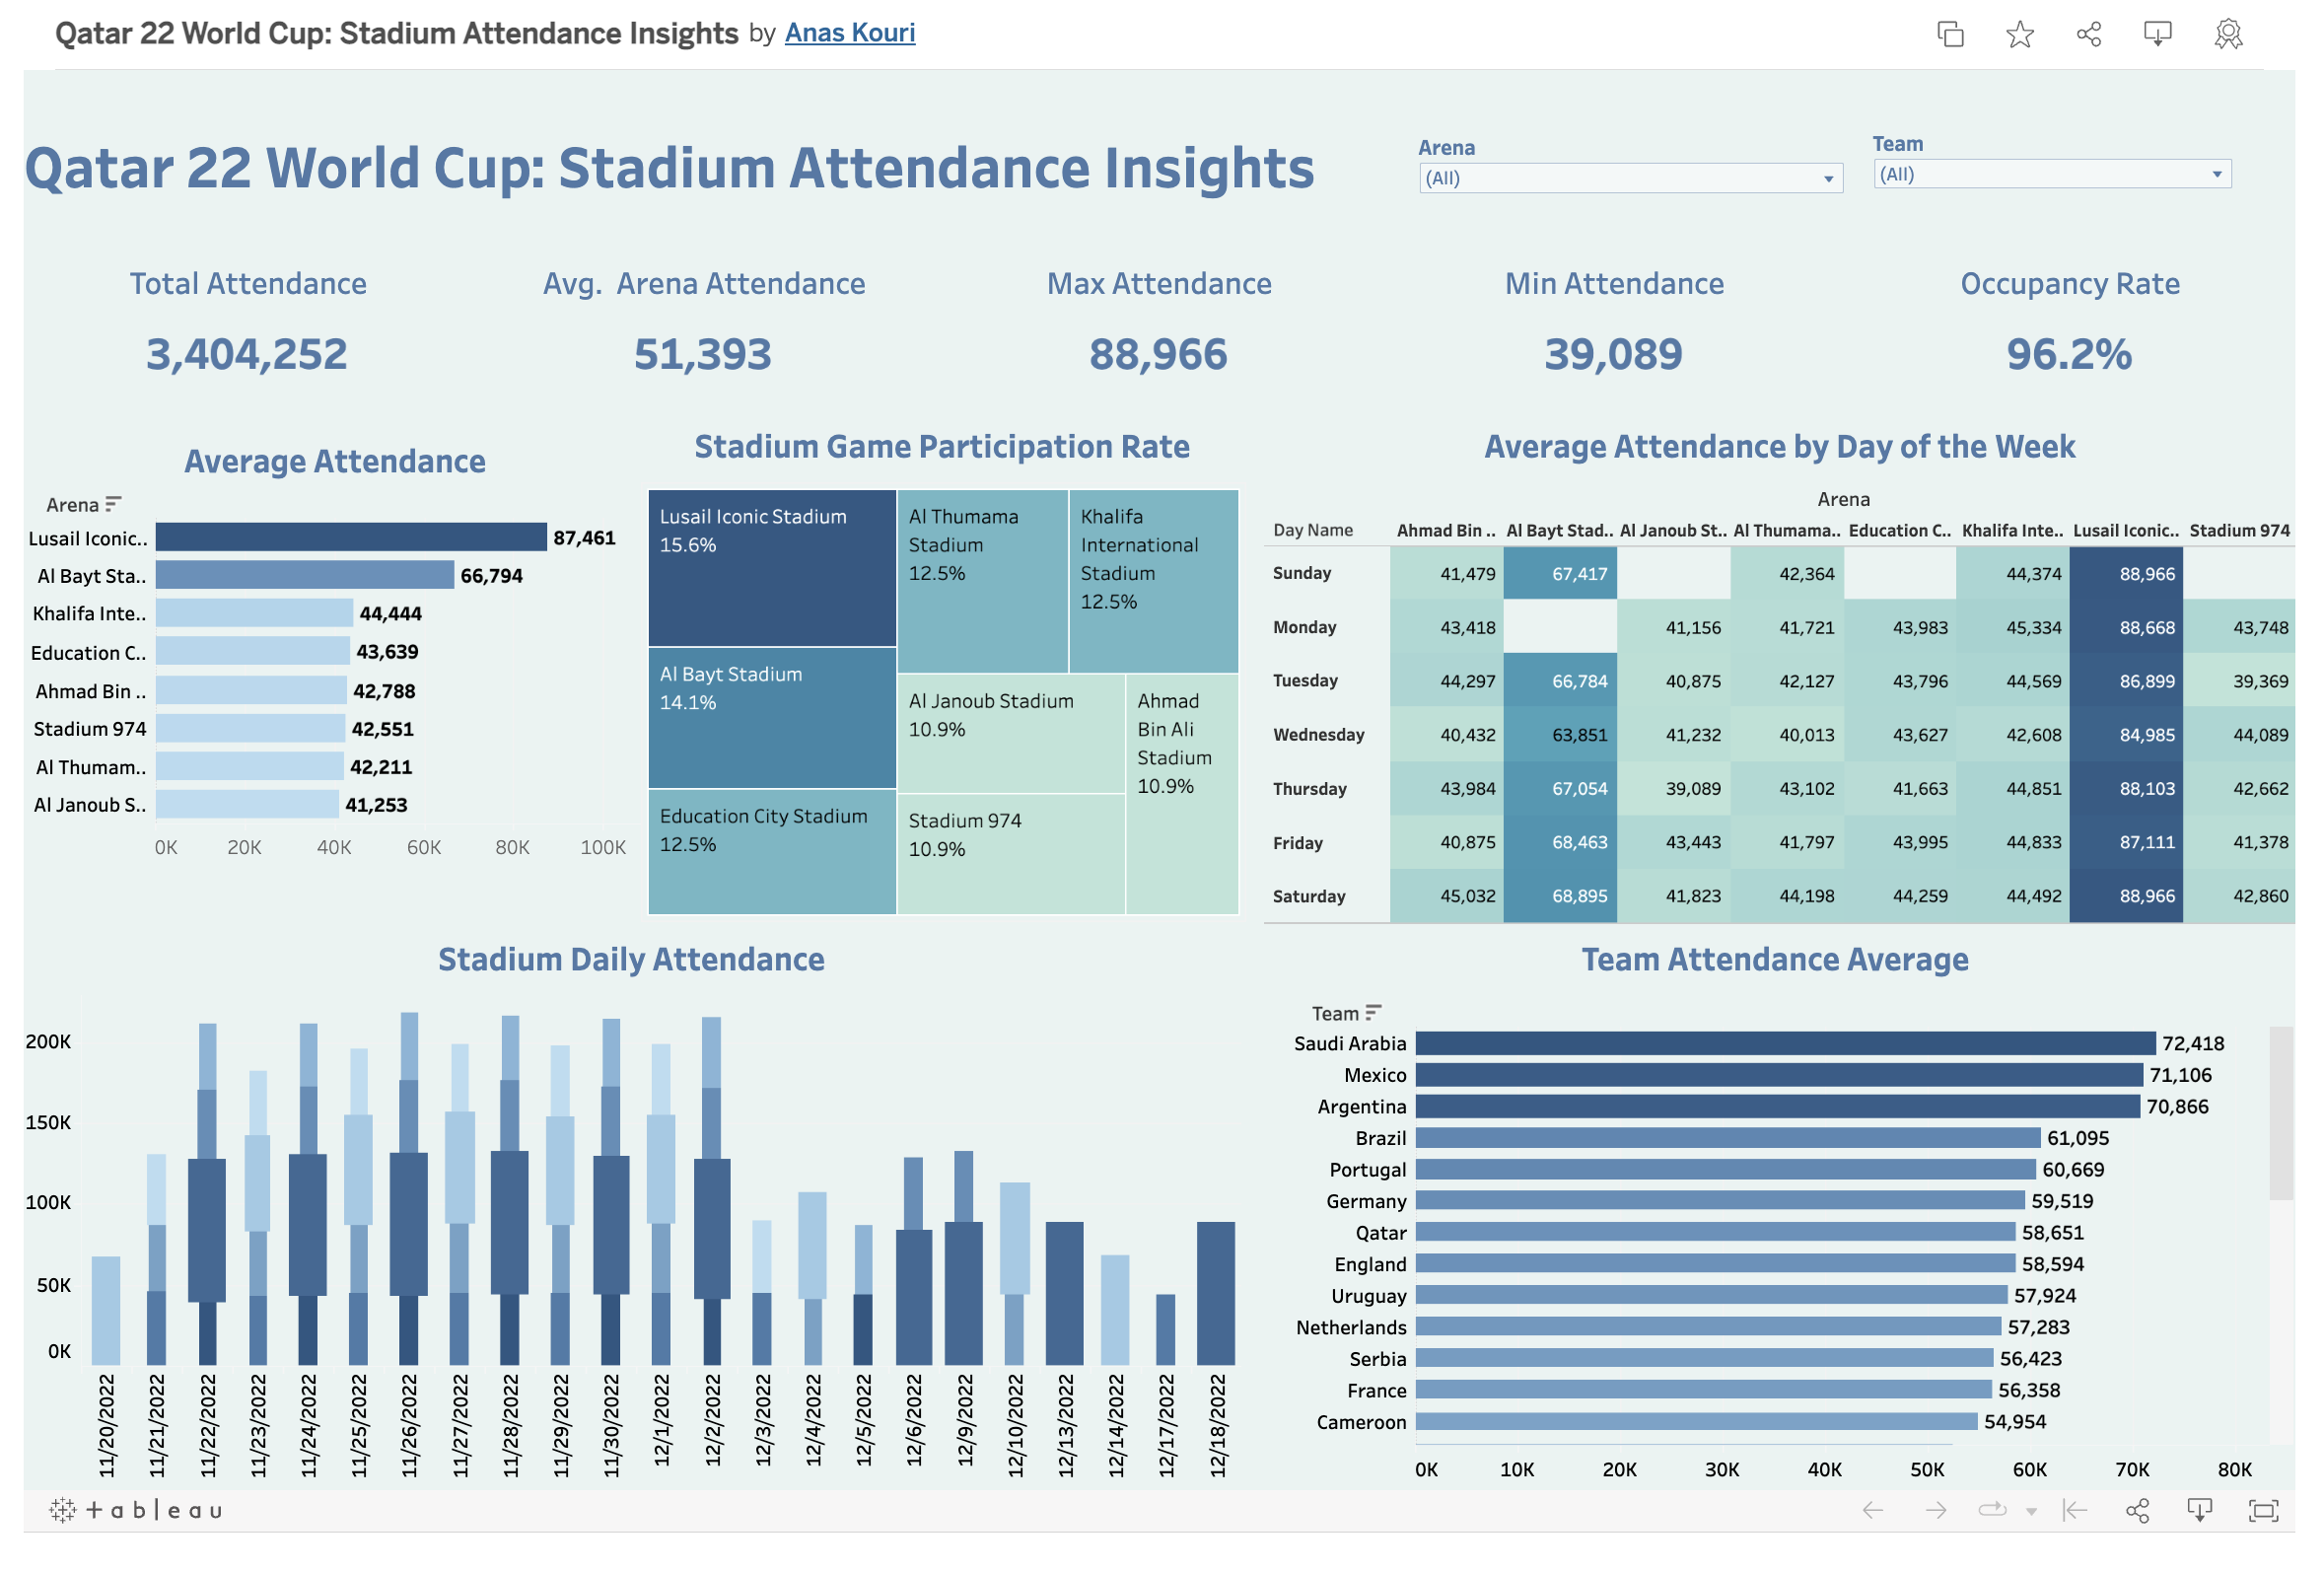
World Cup Qatar 22: Stadium Attendance Insights dashboard
I am thrilled to showcase my latest data visualization project, the World Cup Qatar 22: Stadium Attendance Insights dashboard.
Using SQL and Tableau, I was able to uncover and present key insights on attendance such as average attendance per stadium,
total attendance, maximum and minimum attendance, and occupancy rates. Additionally, I also included the average attendance for each team throughout the tournament.
Check out the interactive dashboard and the SQL code on the description link provided below.
Since the launch of Bitcoin in 2008, hundreds of similar projects based on the blockchain technology have emerged.
We call these cryptocurrencies (also coins or cryptos in the Internet slang). Some are extremely valuable nowadays,
and others may have the potential to become extremely valuable in the future1. In fact, on the 6th of December of 2017,
Bitcoin has a market capitalization above $200 billion.
I have analyzed and visualized data related to Bitcoin and cryptocurrency using python.
By leveraging various python libraries such as pandas and matplotlib,
I was able to extract insights from the data and present them in a clear and visually appealing manner.
I was able to manipulate and clean the data to suit my analysis needs,
and then use various visualization techniques to represent the results in a clear and effective way.
Overall, using python has been a powerful tool in my data analysis and visualization journey,
and has allowed me to gain a deeper understanding of the trends and patterns within the cryptocurrency market.
For more details, here's the github repo related to the project.
Apple is a technology company that makes a range of products, such as smartphones, computers, tablets, and TVs.
It was founded in 1976 and is known for its ability to design and build operating systems, hardware, application software, and services.
Apple differentiates itself from competitors like Samsung, Google, and Amazon by including hardware and software in its products
and designing them to be basic, user-friendly, integrated, and visually appealing.
Apple has a strong brand following and its mission statement emphasizes customer satisfaction,
product quality, and continuous improvement, as well as its responsibilities to the community.
However, the company has faced criticism for its tax avoidance strategies, which involve sending profits to tax haven countries like Ireland.
Link for the report.
Technologies
Data Analysis
Data visualization
SPSS
Contact
Feel free to contact me if you have any question or just to say hi, I’ll try my best to get back to you!